

- 1 Real Business Cannot Be Explained by a Single Cause
- 2 What Is Multiple Regression Analysis?
- 3 Two Approaches: Hypothesis-Based vs. Exploratory
- 4 What We Learned by Comparing the Two Approaches
- 5 What Does “Alternating Between the Two” Look Like in Practice?
- 6 Practical Applications of Multiple Regression
- 7 Looking Back on All Six Sessions: A Changed Relationship with Data
Real Business Cannot Be Explained by a Single Cause
The simple regression analysis we learned in Day 3 examined one cause and one effect — for example, “When advertising spend increases, sales increase.”
But in the real world, sales are not driven by advertising alone. Location, store size, number of staff, distance from competitors, price positioning — multiple variables intertwine to produce any given outcome.
The theme of Day 6, the final session, was multiple regression analysis — the tool for tackling this complexity. And at the heart of the discussion was a fundamental question: “Does the hypothesis come first, or the data?”
What Is Multiple Regression Analysis?
Where simple regression uses y = a + bx (one explanatory variable), multiple regression takes the form:
y = a + b1x1 + b2x2 + b3x3 + …
It is an analytical method that handles multiple explanatory variables (candidate causes) simultaneously.
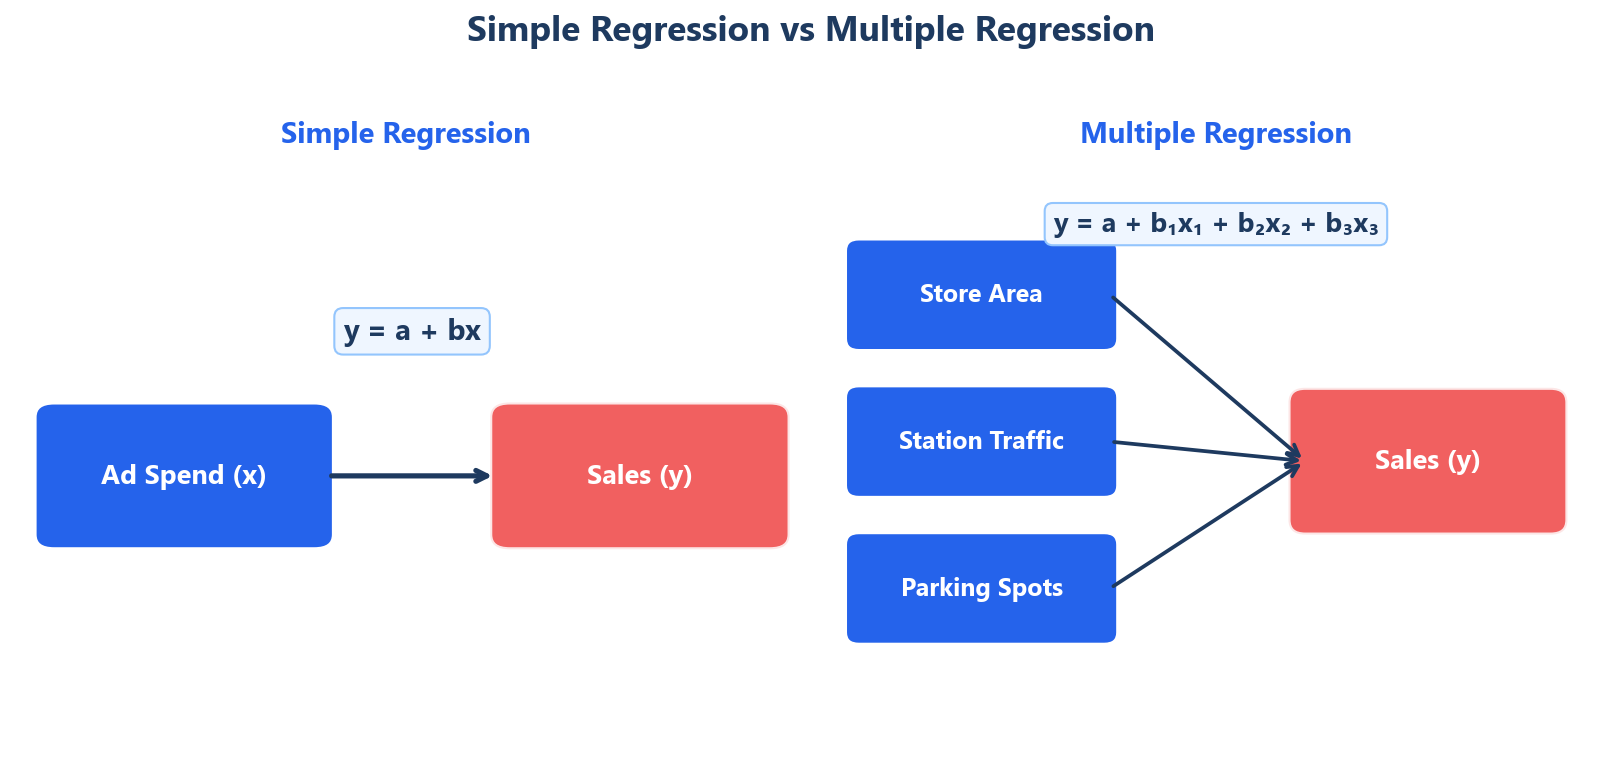
For example, to explain each restaurant chain location’s sales (y), you might use:
- x1: Store floor area
- x2: Daily passengers at the nearest station
- x3: Number of parking spaces
- x4: Number of competing stores nearby
The resulting equation quantifies “which variables influence sales and by how much.”
Two Approaches: Hypothesis-Based vs. Exploratory
In the Day 6 case, we used data from a restaurant chain’s stores to build regression models using two entirely different approaches.
Approach 1: Hypothesis-Based
In the hypothesis-based approach, you draw on business knowledge to hypothesize which variables matter, then select the explanatory variables yourself.
You start by reviewing the case materials and drawing on industry knowledge to list the factors likely to influence sales. Then, through deliberate judgment — “this variable should be included,” “this one is likely noise, so I’ll exclude it” — you select your variables and construct the regression equation.
Advantages:
– Easier to interpret results within the business context
– Variable selection rationale can be explained, making organizational buy-in easier
– Leverages industry-specific knowledge and frontline intuition
Risks:
– Preconceptions may cause you to overlook important variables
– Susceptible to analyst bias
Approach 2: Exploratory (Backward Elimination)
The exploratory approach works in the opposite direction.
You start by including all candidate variables, then remove those that are statistically insignificant one by one. This method is known as backward elimination.
Using analytical tools like Excel or R, variables are selected mechanically based on P-values (a measure of statistical significance).
Advantages:
– Objective and less prone to bias
– Can reveal the importance of variables the analyst had not considered
– The process is standardized, ensuring high reproducibility
Risks:
– Statistically significant variables may lack business meaning
– Requires vigilance for correlations between variables (multicollinearity)
– It can be difficult to explain “why this variable is in the model”
What We Learned by Comparing the Two Approaches
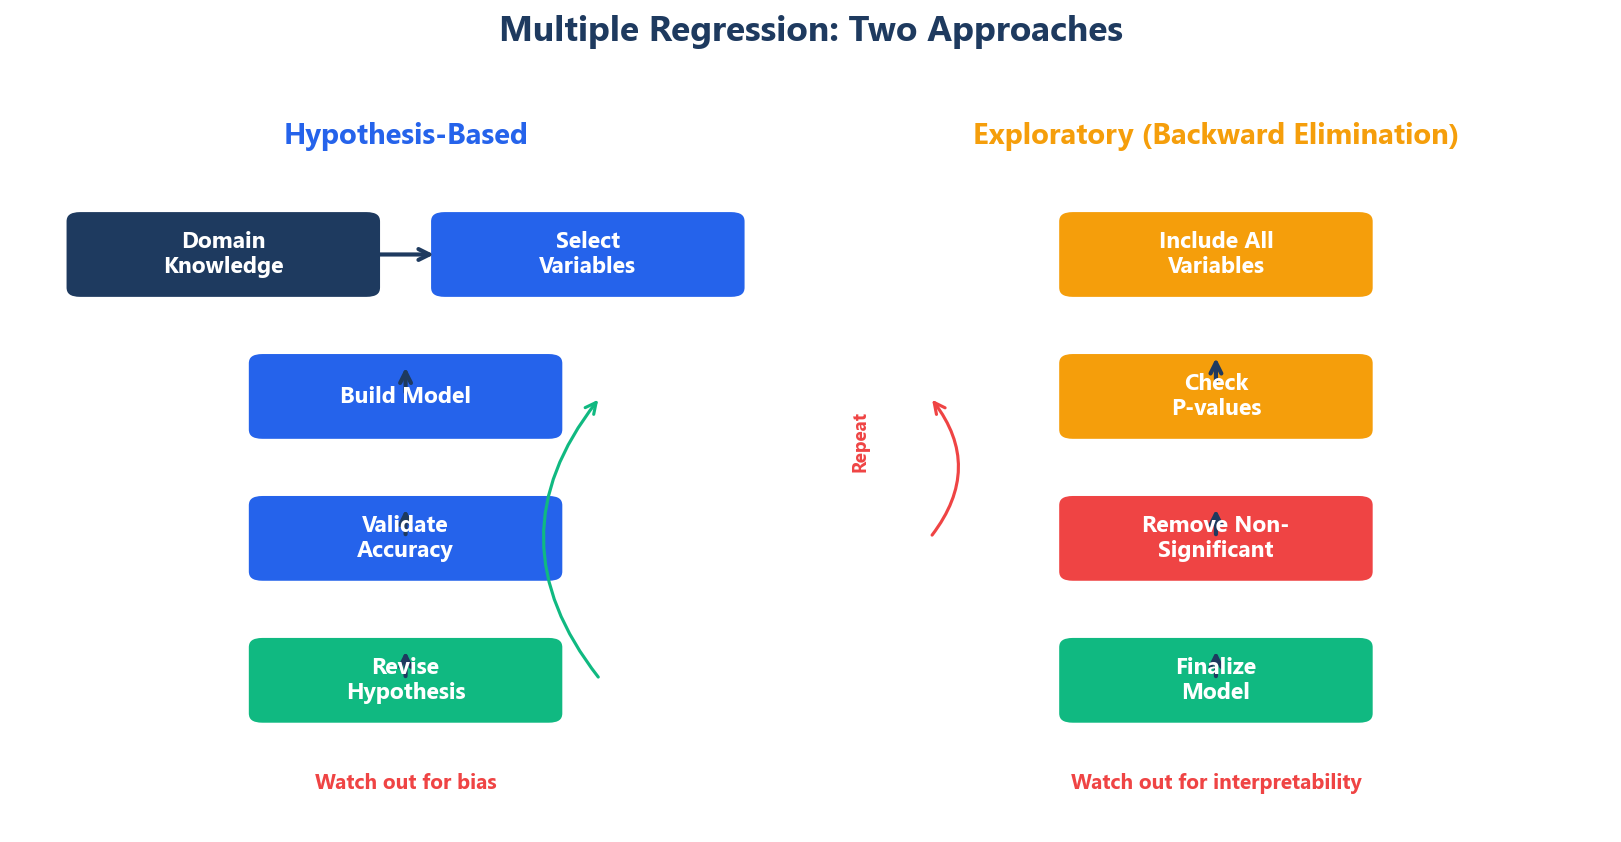
In class, we built models using both approaches on the same dataset and compared their predictive accuracy (the gap between actual and predicted sales).
What was particularly interesting was that the two approaches sometimes retained different variables.
A variable the hypothesis-based model included as “surely influential” might be eliminated in the exploratory model. Conversely, a variable the analyst had not considered might be deemed statistically significant in the exploratory approach.
This divergence is exactly where the learning lies.
The hypothesis-based approach can only analyze within the boundaries of your own thinking. Meanwhile, the exploratory approach uses the power of statistics to break through those boundaries. However, results that are statistically significant but cannot be explained in a business context should not be used blindly.
That is why, in practice, the most effective approach is to alternate between both methods rather than relying on either one exclusively.
What Does “Alternating Between the Two” Look Like in Practice?
Here is a concrete picture of that alternation:
- Start with a hypothesis-based model. Select variables using industry knowledge and frontline intuition.
- Then build an exploratory model. Include all variables and let statistical criteria narrow them down.
- Compare the two results. Variables that appear in both models carry high confidence. Variables that appear in only one require further investigation.
- For the variables where the models diverge, consider whether a business-context explanation exists.
- Revise hypotheses as needed and rebuild the model.
This process of alternation is the culmination of the cycle that has run through every session since Day 1: “Approach data with a hypothesis, then update your hypothesis based on what the data reveals.”
Practical Applications of Multiple Regression
Multiple regression analysis is applicable across a wide range of business contexts:
- Store location planning: Identify the location factors that drive sales and forecast revenue for potential new sites
- HR analytics: Quantify the factors affecting performance (training, years of experience, team composition, etc.)
- Marketing ROI assessment: Isolate and measure the impact of individual marketing initiatives on sales
- Quality management: Identify the manufacturing conditions that influence defect rates and prioritize improvements
In every case, the decision of which variables to include in the model determines the quality of the analysis — a lesson Day 6 made viscerally clear.
Looking Back on All Six Sessions: A Changed Relationship with Data
At the end of the Day 6 class, we had time to reflect on the full six-session journey.
Viewed from above, the six sessions form a coherent arc:
- Days 1-2: Analytical mindset and foundational skills (decomposition, pre-processing, visualization)
- Day 3: Analyzing relationships (inductive and deductive approaches)
- Day 4: Comprehensive exercise (integrating all methods learned)
- Day 5: Navigating future uncertainty (sensitivity analysis, decision trees)
- Day 6: Analyzing complex causal relationships (multiple regression)
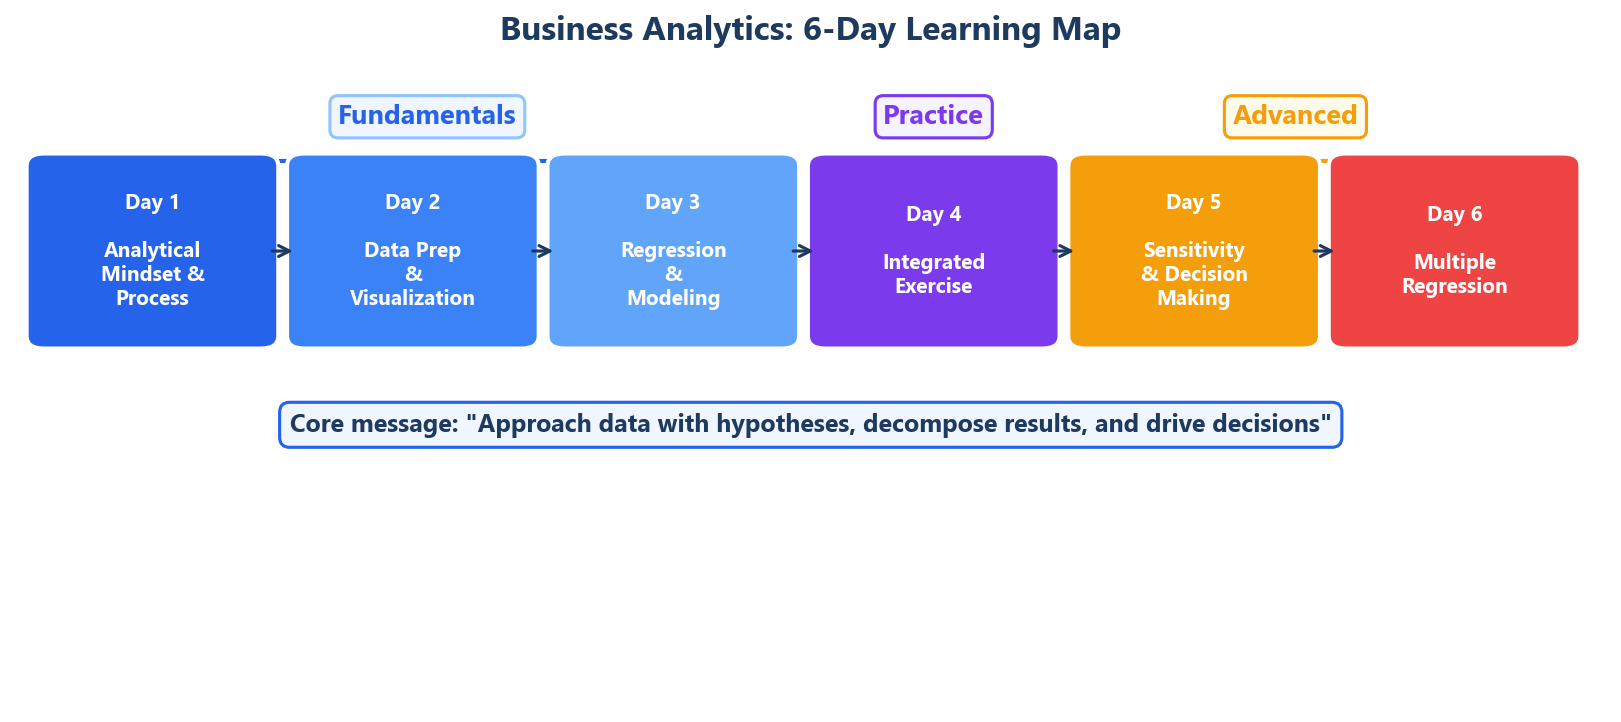
The unifying message throughout was a simple principle: “Approach data with a hypothesis, break down the results, uncover causal relationships, and apply the insights to decision-making.”
Three Capabilities This Course Developed
Looking back, the three areas where I changed the most are:
1. Decomposition
When I see a number now, my natural instinct is to ask, “What does this look like when you break it down?” Sales, costs, customer satisfaction — any result becomes more actionable once decomposed.
2. Purposeful Visualization
Instead of “Let’s just put this in a chart and see,” I now think, “What am I trying to reveal, and which chart serves that purpose?” Visualization has become goal-driven.
3. Decision-Making Under Uncertainty
Even in ambiguous situations, I have shifted from “deciding by feel” to “structuring the problem, comparing with numbers, and deciding with evidence.”
For Those Considering This Course
Every method covered in Business Analytics can be executed in Excel. No advanced statistical software or programming skills are required.
But the true value of this course is not the methods themselves — it is developing the discipline of how you engage with data.
Start with a hypothesis. Break down the results. More haste, less speed.
By internalizing these simple principles, the way you use data in everyday work changes dramatically.
The greatest reward from this six-session course was gaining the confidence to speak with numbers. That, more than any individual technique, is what I will carry forward.
Reference Books
– Business Analytics by James Evans — Covers multiple regression and advanced analytical methods in depth


– Thinking, Fast and Slow by Daniel Kahneman — Relevant for reflecting on how cognitive biases affect our choice of variables and model interpretation