

How Do You Face an Uncertain Future?
In business decision-making, almost nothing is certain.
You cannot predict exchange rate movements. You do not know when a competitor will launch a new product. You cannot foresee regulatory changes. You have no idea how far a new venture’s revenue will grow.
Yet executives and managers must still make decisions. “I can’t decide because I don’t know” is not an option.
How do you make rational decisions amid an uncertain future? Day 5 tackled this enduring challenge of leadership head-on.
Two Weapons for Day 5
Day 5 introduced two frameworks for confronting uncertainty:
- Sensitivity Analysis: Identify what matters most
- Decision Trees: Systematically compare your options
Neither attempts to predict the future with certainty. Instead, they are tools for making uncertainty visible and improving the quality of your decisions.
Sensitivity Analysis: What Happens When You Move the Levers?
The Core Concept
Imagine a mixing console. Treble, bass, volume — multiple sliders, each changing the output when adjusted.
Business works the same way. Revenue, raw material costs, labor costs, exchange rates — various variables (levers) all influence the final outcome (profit).
Sensitivity analysis quantifies how much the result changes when each variable is adjusted individually, then ranks the variables by impact.
This enables a shift from “preparing for every risk equally” to “focusing your preparation on the risks that matter most” — a far more rational approach.
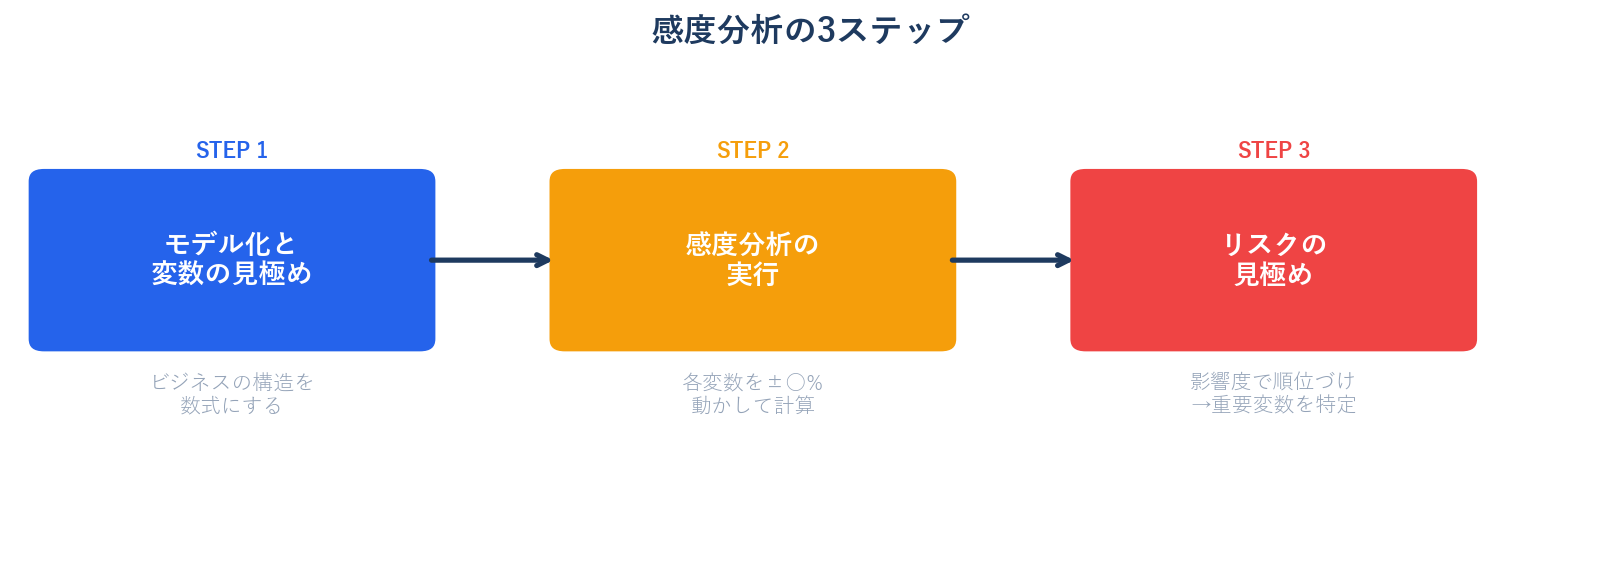
Three Steps of Sensitivity Analysis
- Model and identify variables: Using the modeling skills from Day 3, translate the business’s causal structure into equations. Clarify which factors are variables and how they relate to each other.
- Run the sensitivity analysis: Calculate the outcome when each variable is shifted by a set percentage (e.g., plus or minus 20%) from the baseline.
- Assess the risks: Rank variables by their impact on the result and identify the most critical ones.
Tornado Charts: Impact at a Glance
A tornado chart is the visualization tool for sensitivity analysis results.
Each variable’s outcome range (when shifted up and down) is displayed as a horizontal bar, arranged from most impactful at the top to least at the bottom. The resulting shape resembles a tornado.
For example, applying a tornado chart to a startup’s profit plan might show:
- Revenue: A plus or minus 20% shift causes profit to swing by 60 million yen
- Raw material cost ratio: Plus or minus 20% shifts profit by 30 million yen
- Fixed costs: Plus or minus 20% shifts profit by 20 million yen
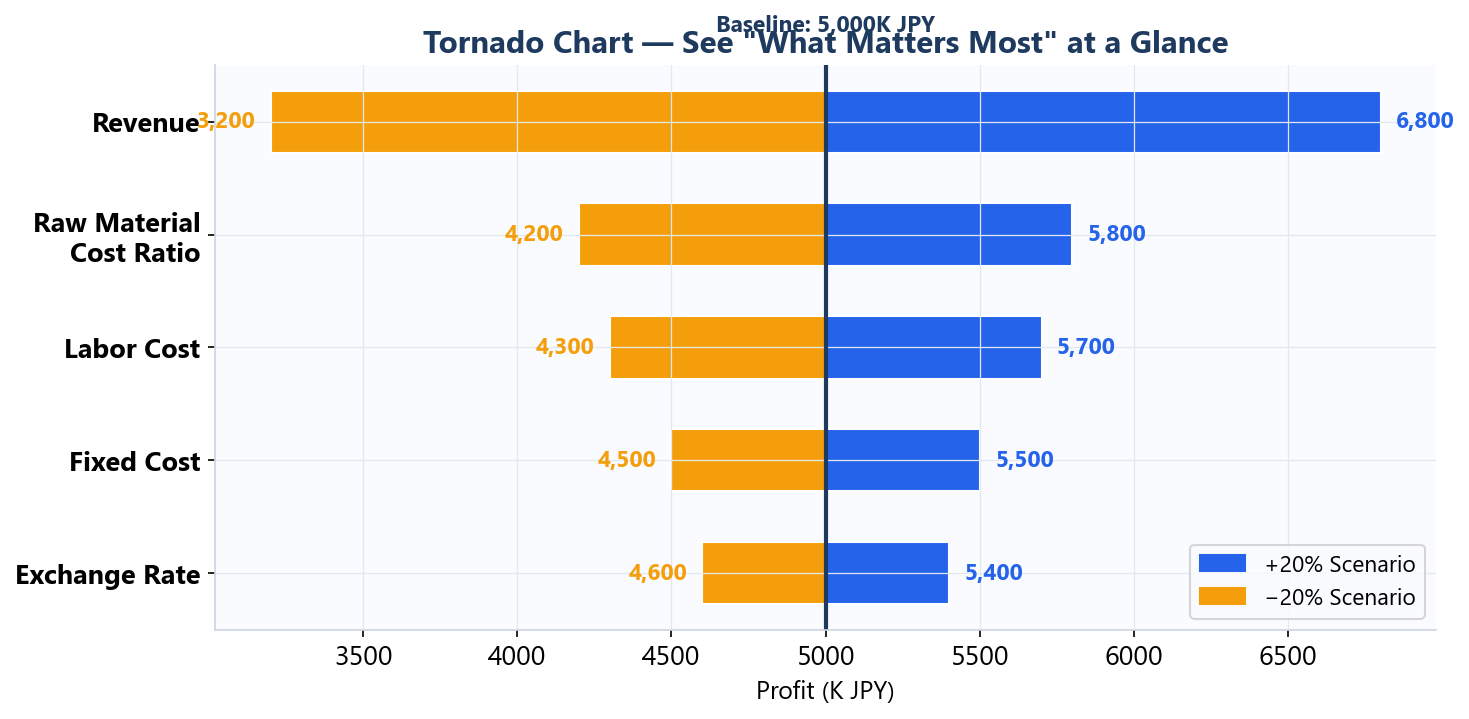
At a glance, it is clear that revenue variability is the most critical factor. Therefore, the greatest resources should be allocated to improving revenue forecast accuracy, and contingency plans for revenue shortfalls should be the top priority.
A tornado chart may be the single most powerful slide for an executive meeting when discussing “What should we address first?”
Case Study: A Startup’s Strategic Decision
In the first half of Day 5, we applied sensitivity analysis to a growing startup’s business plan.
The assignment: from the CEO’s perspective, identify and justify the three risk factors that deserve the most vigilance.
The challenge here was handling variables for which the case provided no specific numbers. “Is this cost fixed or variable?” “How fast is this market growing?” We had to set assumptions ourselves.
Your own judgment shapes the model at the assumption-setting stage. That is why sensitivity analysis results are not absolute truths but rather conditional decision inputs — “Given these assumptions, these are the priorities.” Change the assumptions, and the conclusions change too. In practice, sharing and debating those assumptions is just as important as the analysis itself.
Decision Trees: Visualizing and Comparing Your Options
Comparing by Expected Value
The second half of Day 5 covered decision trees and the expected value principle.
When facing multiple options under uncertainty, a decision tree maps out each option’s possible scenarios, their probabilities, and their outcomes in a tree structure.
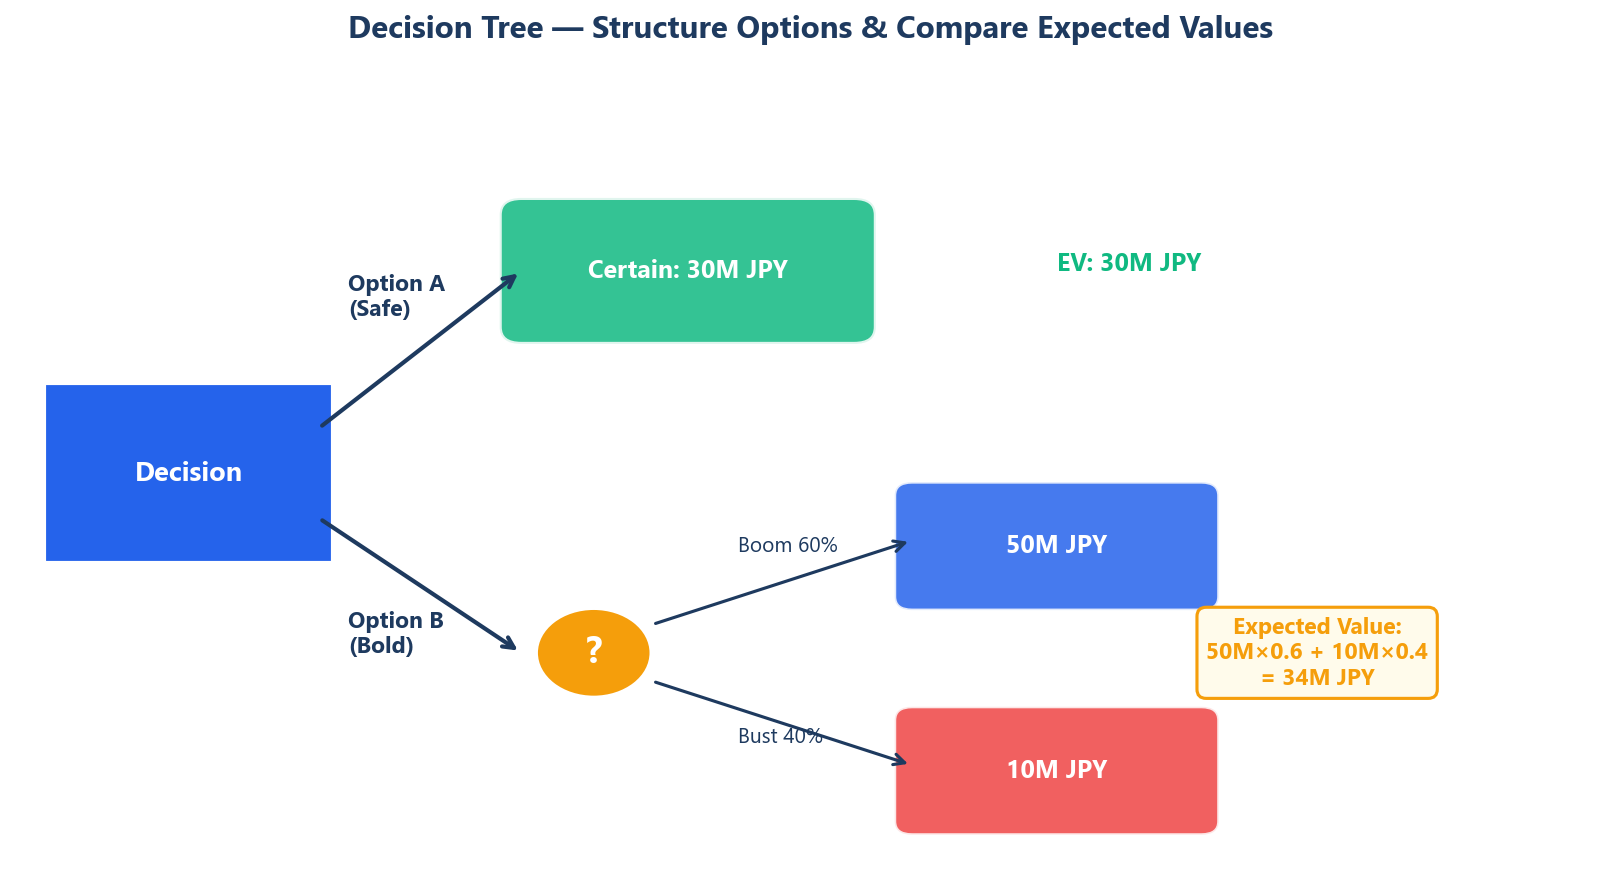
By calculating the expected value (probability-weighted average of outcomes) for each option, you can determine which choice is statistically most favorable.
Case Study: Natural Disaster Risk and Harvest Timing
The decision tree case involved a winery owner deciding when to harvest grapes in the face of storm risk.
- Harvest now: Produce wine of guaranteed average quality
- Delay the harvest: If no storm hits, the wine will be exceptional; if a storm strikes, the loss is severe
Structuring this decision with a decision tree yields expected values for each option. You can compare “the risky option with the higher expected value” against “the safe option with the lower expected value” — using numbers rather than gut feeling.
Quantifying the Value of Information
Even more fascinating was the follow-up question: “How much would you pay for that information?”
If you had access to a perfectly accurate storm forecast, how much should you be willing to pay for it?
Using a decision tree, you can calculate the economic value of information as the difference between the expected value with perfect information and the expected value without it.
This concept translates directly to real-world decisions:
- How much should you spend on market research?
- What is the value of a consultant’s advice?
- Does the return justify the time cost of gathering additional data?
When you feel the urge to “do more research before deciding,” you can actually quantify the value of that additional research. This is an extraordinarily powerful thinking tool for any business professional.
The Biggest Lesson from Day 5
What stayed with me most from Day 5 was the connection between sensitivity analysis and decision trees.
Sensitivity analysis identifies “what matters most” (the critical variable). Decision trees then help you decide “which option to choose, given that variable.”
Combining the two enables systematic risk management in the face of an uncertain future.
Modeling (Day 3) -> Sensitivity analysis to identify key variables -> Decision tree for the final call
This sequence applies to new business planning, project risk assessment, investment decisions — virtually any business decision.
Three Takeaways from Day 5
- Preparing equally for every risk is unrealistic. Use sensitivity analysis to pinpoint the highest-impact variables and focus there.
- Move from “choosing by instinct” to “structuring and comparing.” Decision trees and expected values let you evaluate options quantitatively.
- The value of information can be calculated. Even the cost-benefit of additional research is a legitimate subject for quantitative analysis.
Day 5 marked a shift from the Day 1-4 world of “analyzing past data” to “confronting future uncertainty.” The pivot from “understanding what happened” to “deciding what to do” felt like the moment where data truly becomes a tool for business leadership.
In Day 6, we tackle multiple regression analysis — untangling the complex causal relationships where many variables interact at once.
Reference Books
– Smart Choices by Hammond, Keeney & Raiffa — Directly covers decision trees and structured decision-making frameworks